|
8.2
general documentation
|


|
|
8.2
general documentation
|
|
For solvers such as code_saturne, which can run on large resources for long durations, improving performance is always essential, to reduce both user wait times and IT costs (of which a large part is nowadays energy cost).
Performance gains are usually a combination of progress in computing power and in algorithms. For similar software over the last few decades, both factors have been important, with algorithm progress being a major driver.
So although the first step in improving program performance is on the algorithmic (and theory) side, detailed analysis of the behavior of those algorithms on actual hardware is important.
To assist developers and users in performance optimization, code_saturne includes many timers, and tries to log synthetic performance information.
This allows comparing the performance of numerical options and checking that no "unexpected" performance bottlenecks are present.
For more detailed analysis, the use of profiling tools is recommended.
To be able to understand the performance behavior of code_saturne, the user should have at least introductory knowlege of several hardware and programming model related aspects.
When running, the code_saturne solver generates a timer_stats.csv file, which traces the elapsed time for each major operation type (mesh modification, post-processing, gradient reconstructions, linear solvers, and such). This information may be easily plotted using a spreadsheet or a visualization tool such as ParaView.
The code also generates a performance.log file, which summarizes timings for various operations, in a manner independent of the number of time steps actually run (so this file is complete only after a successful run).
To obtain more detailed performance information, use of a profiling tool is needed.
Use --enable-profile to configure builds for profiling.
Several types of tools may be available. We list a few commonly available tools, though the list is far from exhaustive:
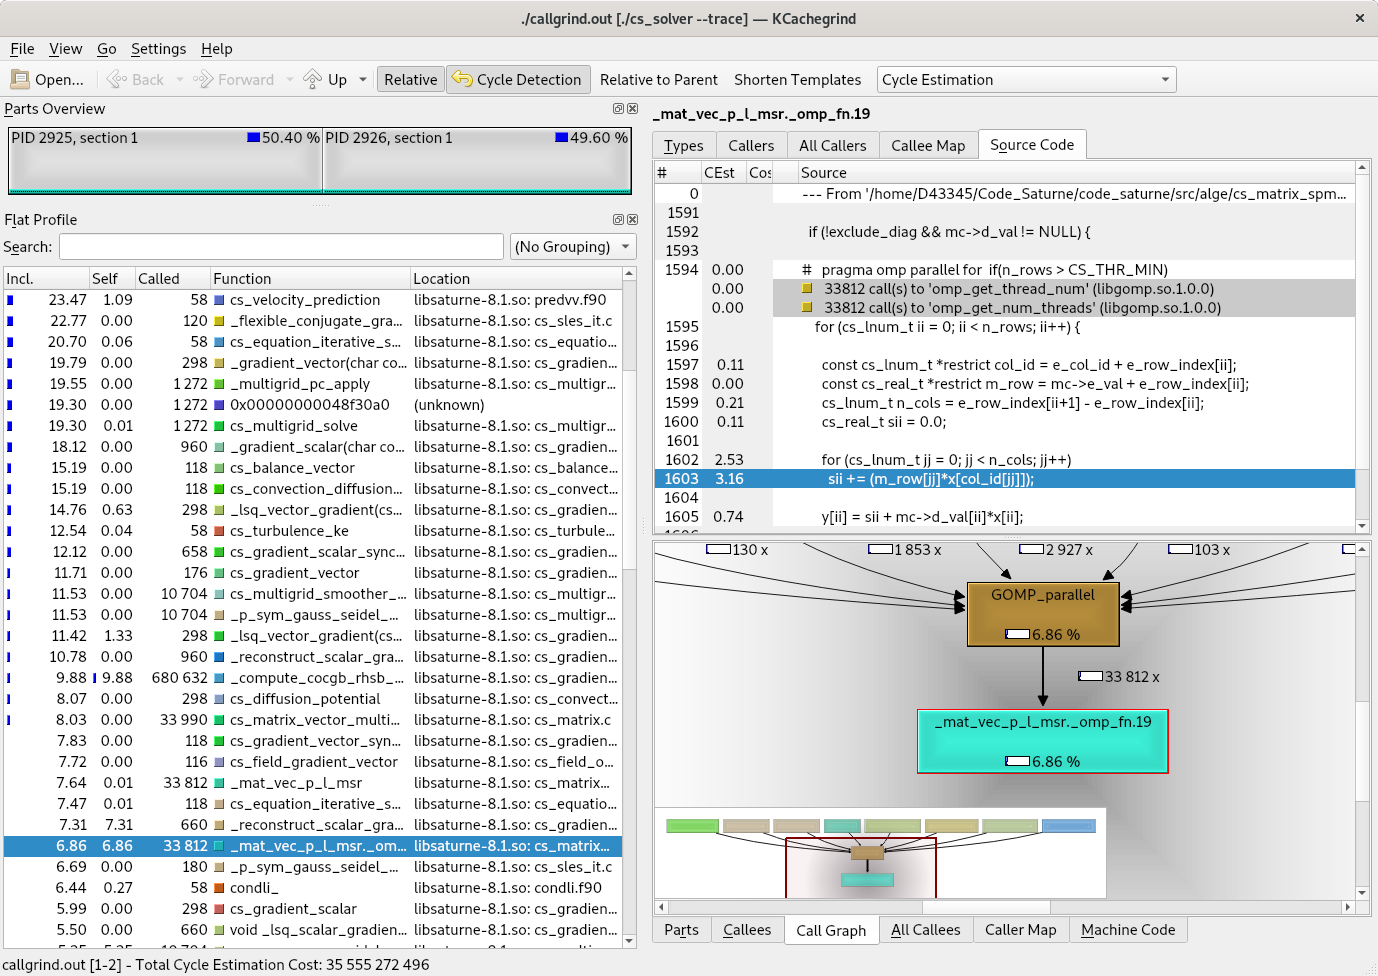
The Valgrind tool suite includes several tool which are very useful for profiling. Note that as usual when running under Valgrind, there is an overhead relative to actual performance, and the obtained timing results may be simulated as much as measured, but the information obtained is very similar to that obtained with less ubiquitous tools.
Combined with the kcachegrind visualization tool, it is extremely easy to use on a Linux workstation. It allows easy visualization of call trees and hot spots, as illustrated below:
Other advanced profiling tools may be provided by various vendors, for example:
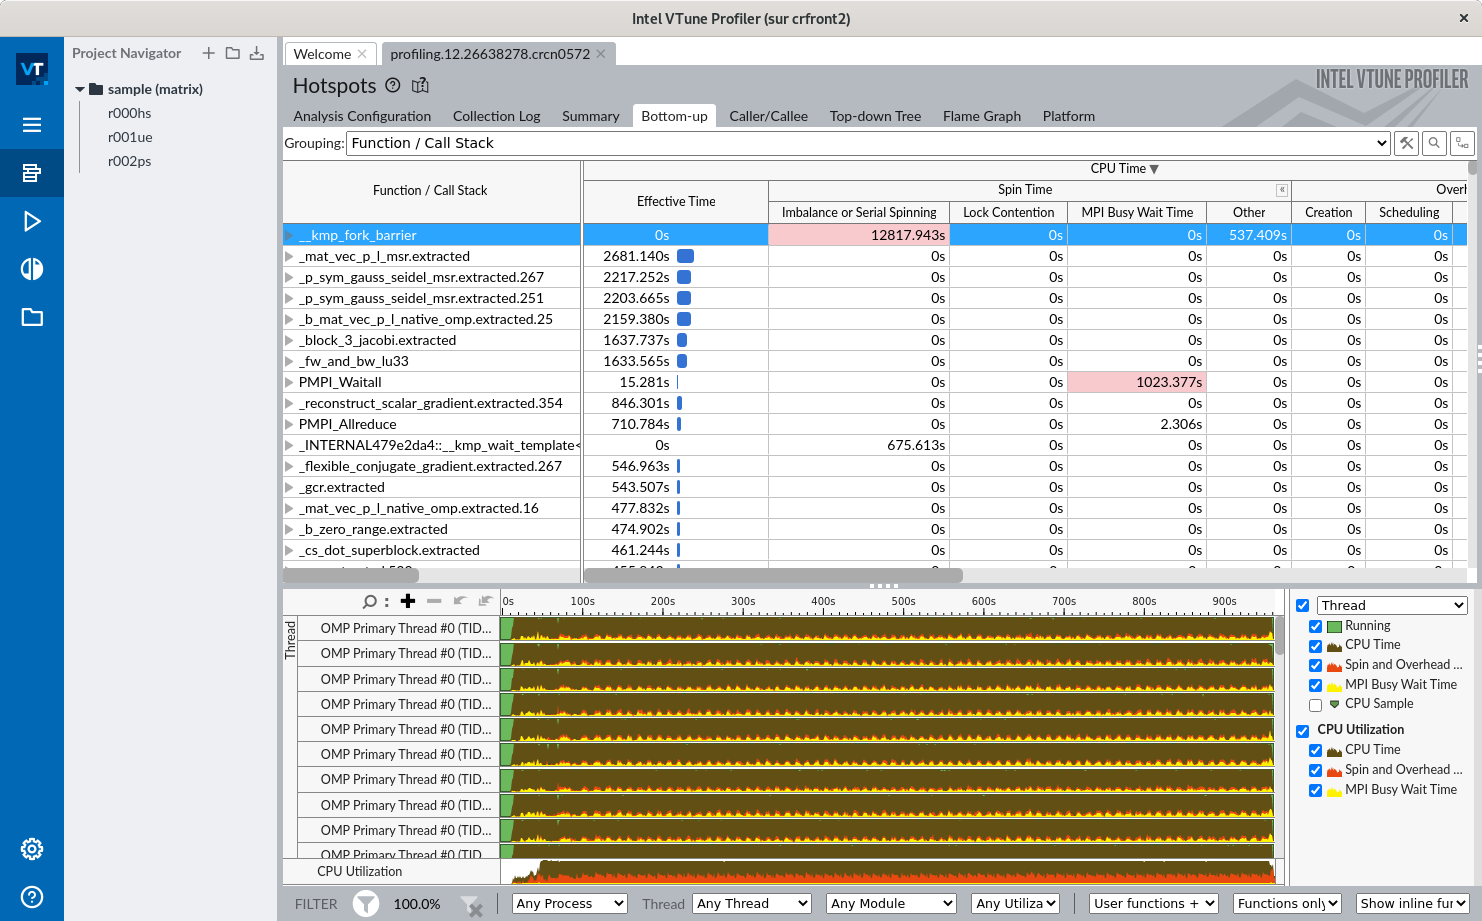
If Intel's VTune is available, the following procedure may be used:
code_saturne submit --initialize In either case, the code will prepare the execution directory, and preprocess the mesh if needed, but not remove the executable and temporary script.cd to the execution directory, and edit the run_solver script script:cs_solver command, insert the profiling commands. For example, replace mpiexec might be replaced by another command, such as srun depending on the system, but the logic remains the same).run_solver script rather than running it directly.runcase file to the same position (starting at line 2) in the run_solver file.runcase starting with #SLURM to run_solver.run_solver file for the VTune installation (intel-Basekit in the previous example).VTune allows many exploration views, for example:
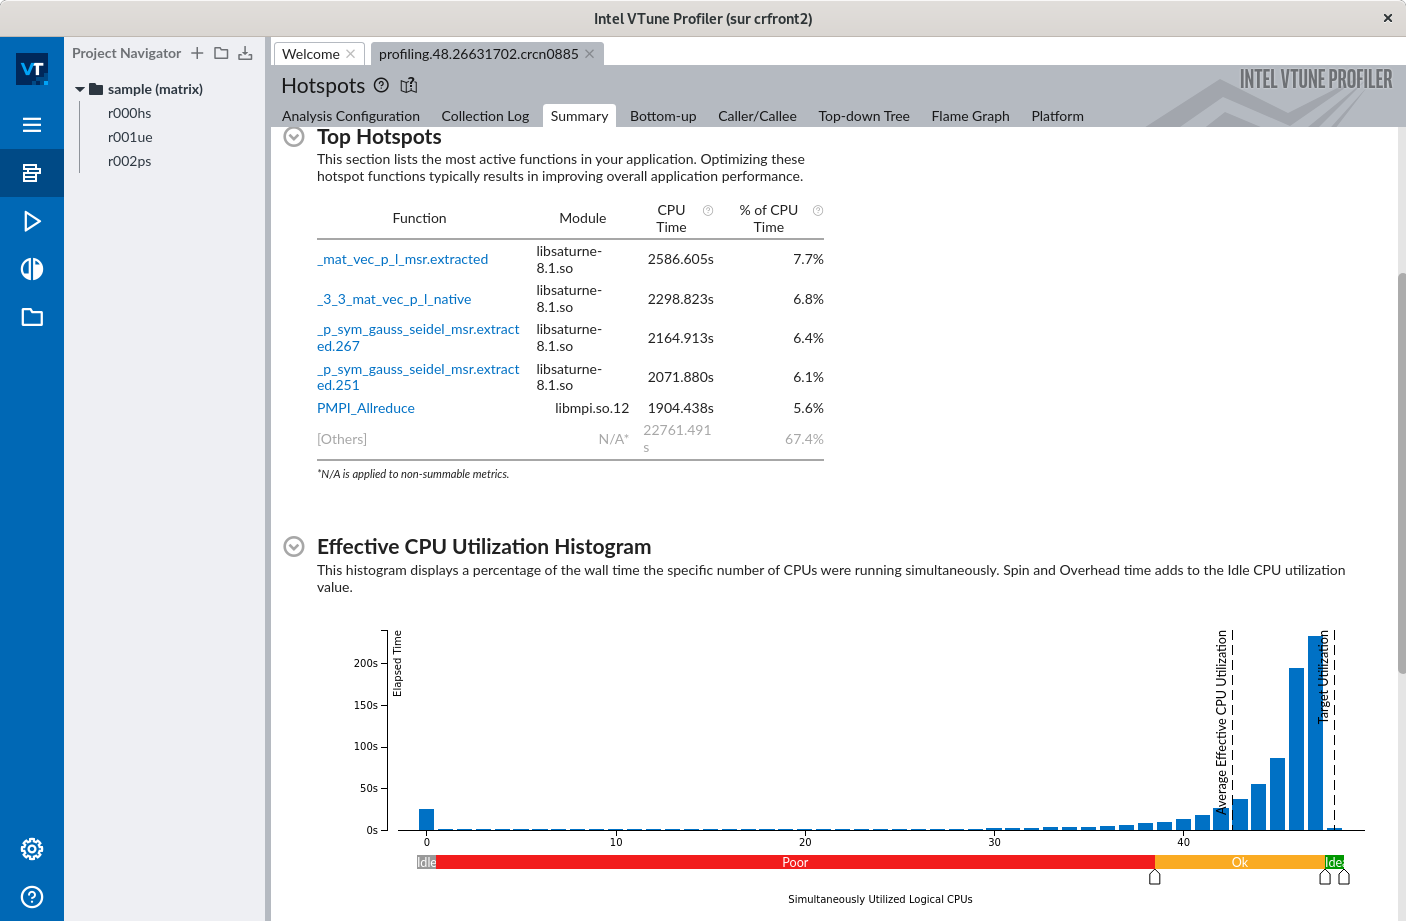
or