|
7.2
general documentation
|


|
|
7.2
general documentation
|
|
All non-trivial software has bugs, at least at first, so debugging is a part of code development.
When encountering or suspecting a bug, choosing the best debugging technique for the situation can lead to one or more orders of magnitude in time savings.
error*, run_solver.log, messages in batch output logs (or in the console) should be checked.error and error_r* are present, the latter are the ones which contain the useful information.postprocessing/error* outputs are also available for boundary conditions and linear solvers.--enable-debug to configure builds for debug.assert checks in C code.The GNU debugger https://www.gnu.org/software/gdb is a broadly available, interactive debugger for compiled languages including C, C++, and Fortran.
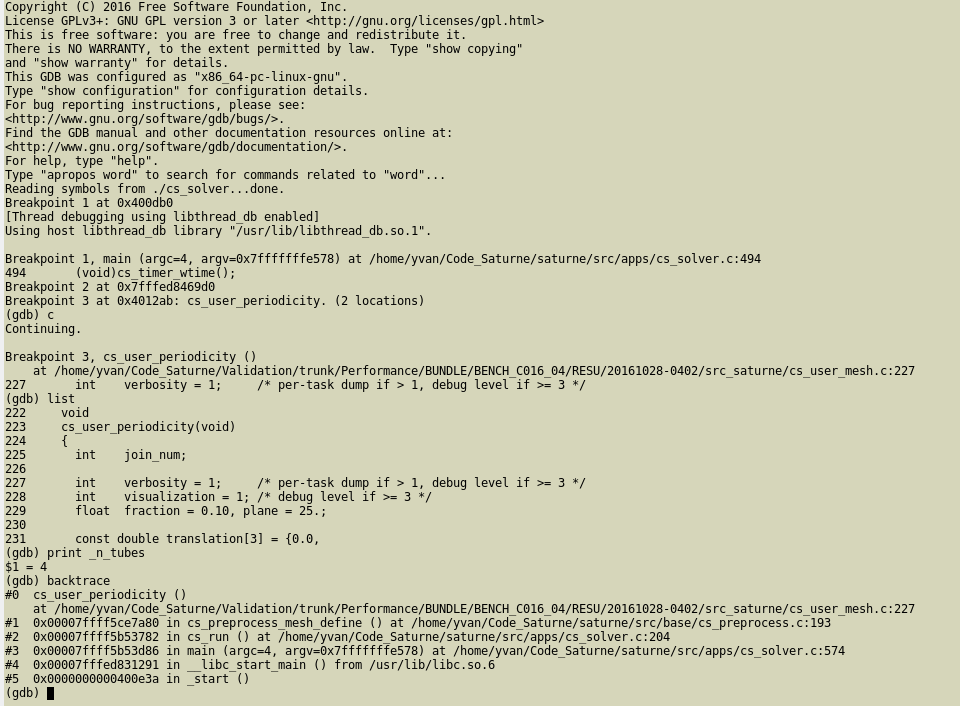
gdb <executable>help for built-in help, q to quit.b (set breakpoint),c (continue to next statement),s (step into function),p (print).-g, and in the case of code_saturne, is provided using the --enable-debug configure option at installation.When used directly, GDB runs in a single terminal frame, as shown here. Only the current line of code is shown, though the list command allows showing more.
When started with the -tui option, GDB runs in a split terminal, with source on top, commands on bottom.
CTRL+x+o key combination allows changing focus from one to the other.CTRL+l key allows refreshing the display.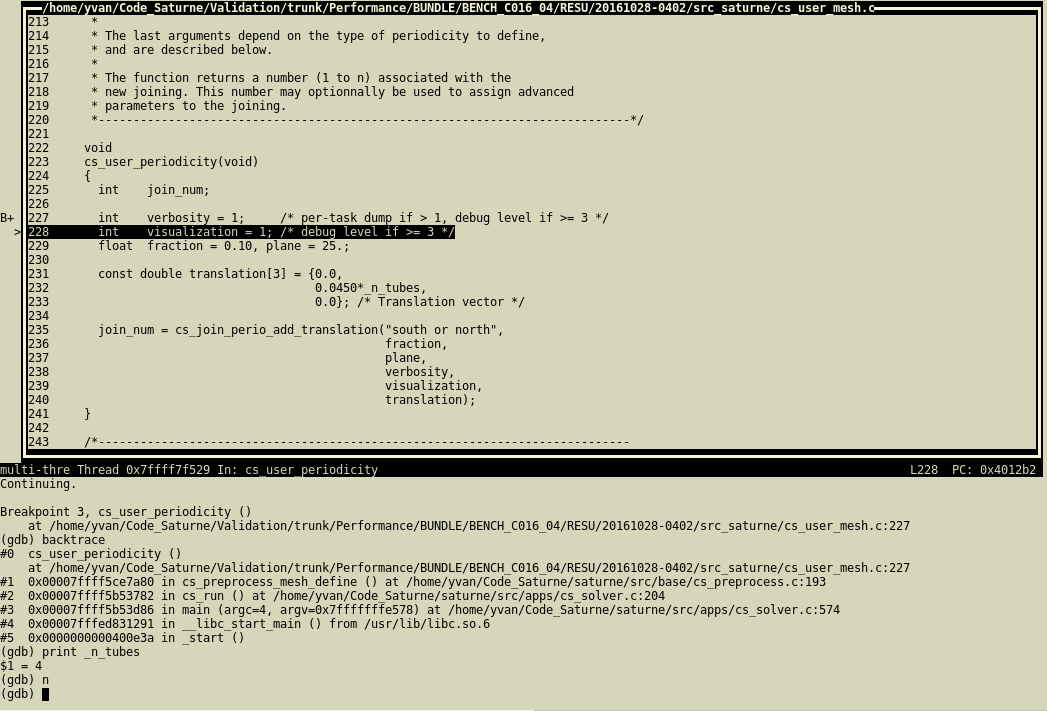
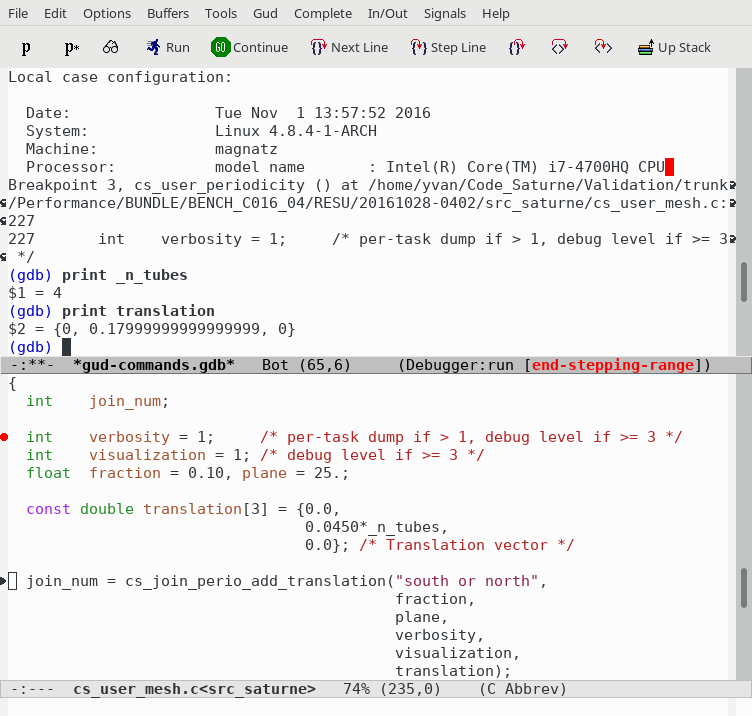
GDB may also be run under Emacs, which provides syntax highlighting of source code.
Many graphical front-ends are available for gdb. When evaluating a front-end, we recommend to check for the following features:
The DDD (Data Display Debugger) front-end is obsolete and uses a dated graphical toolkit, but has the advantage of combining a command prompt with graphical tools, and is very easy to use, so it might remain an option.
The Nemiver debugger also has a GDB back-end. It offers a clean display, but lacks the possibility of typing commands; everything must be done using the mouse and menus, which is often tedious. The project seems abandoned. KDbg is similar, slightly more practical, but does not seem to have been very active since 2018.
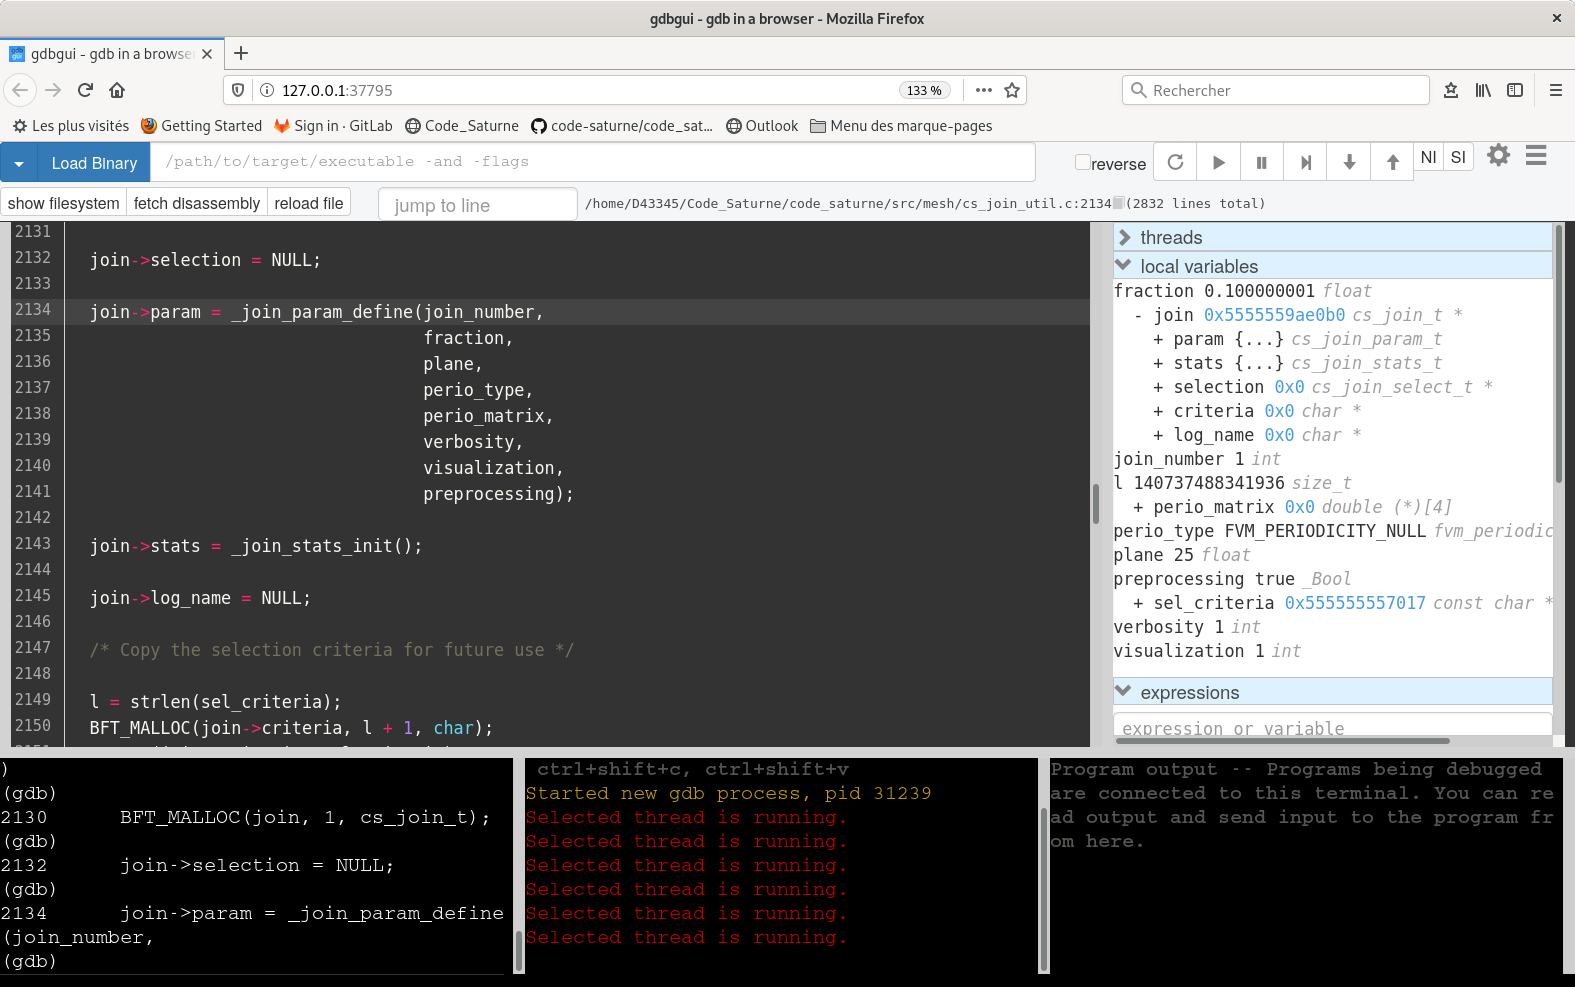
The gdbgui debugger seems promising, and a good potential successor to DDD. It is based on a web-browser interface,
Full integrated development environments (including Qt Creator, Visual Studio Code, Eclipse, Kdevelop, Anjuta) are outside the scope of this documentation. Most members of the code_saturne development team mostly use lighter, less integrated tools, so will not be able to provide recommendations regarding their use.
The Eclipse CDT and Eclipse PTP (Parallel Tools Platform) environments integrate debuggers, including a parallel debugger, but may use a different syntax than "standalone" GDB, so they are not considered here (though feedback and recommendations around these tools are welcome).
The LLDB debugger is an interesting competitor to GDB, with a different (similar but more verbose) syntax. Is is not as widely available yet, and is not yet handled by the code_saturne debug scripts, though a user familiar with it could of course set it up.
The Valgrind tool suite allows the detection of many memory management (and other) bugs.
Valgrind is easy to run:
valgrindmemcheck tool.valgrind –tool=/cachegrind/callgrind/drd/massif/...gdbserver mode.valgrind –vgdb-error=<number>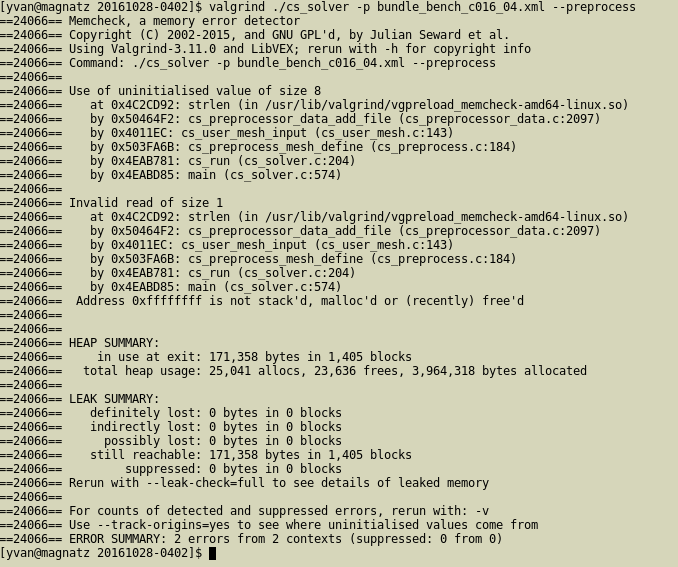
Recent versions of the LLVM clang and GCC compilers have additional instrumentation options, allowing memory debugging with a lower overhead than Valgrind.
For the most common errors, use AddressSanitizer, a fast memory error detector.
CFLAGS=-fsanitize=address FCFLAGS=-fsanitize=address LDFLAGS=-fsanitize=addressexport LD_LIBRARY_FLAGS=<path_to_compiler_libraries when the compiler is installed in a nonstandard path on older systems.ulimit -cAddressSanitizer also includes a memory leak checker, which is useful but may also report errors due to system libraries, so to allow a "clean" exit, we may use:
``` export ASAN_OPTIONS=detect_leaks=0 ```
The UndefinedBehaviorSanitizer instrumentation is also useful to detect other types of bugs, such as division by zero, some memory errors, integer overflows, and more.
-lubsan and even in some cases specify LD_LIBRARY_FLAGSCFLAGS=-fsanitize=undefined FCFLAGS=-fsanitize=undefined LDFLAGS=-fsanitize=undefinedexport LD_LIBRARY_FLAGS=<path_to_compiler_libraries as per AddressSanitizer.Several ways of setting code_saturne to run under a debugger are possible:
debug_args option under the current resources section in the case's run.cfg file, which can also be edited directly.code_saturne run using the --debug-args option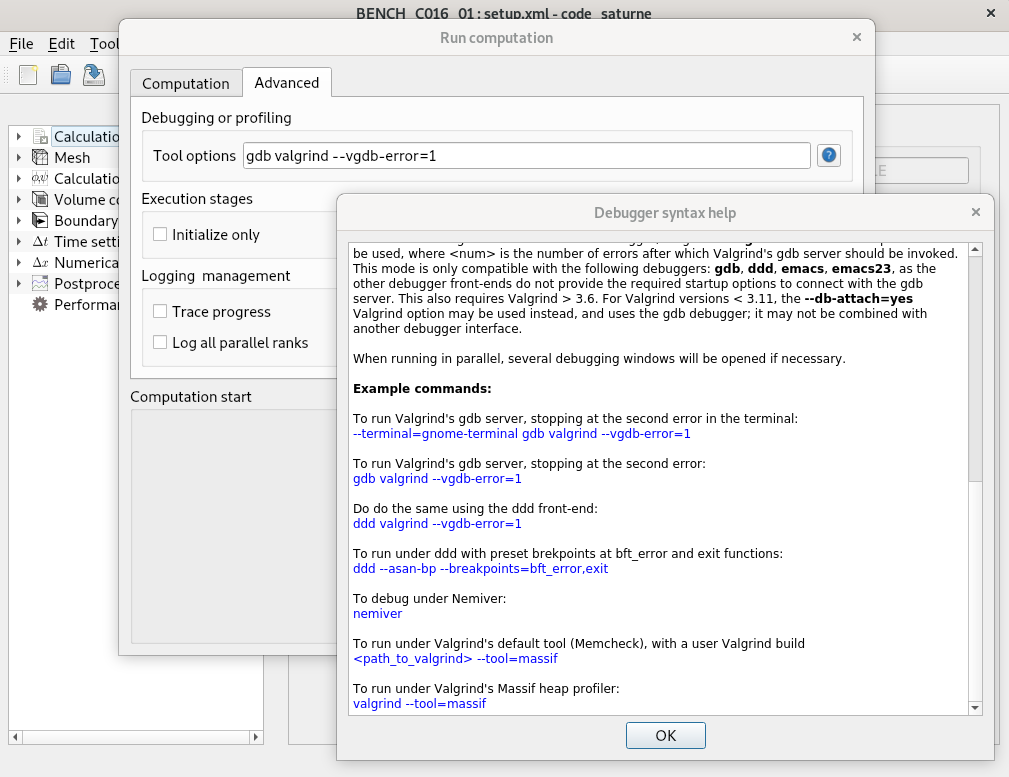
When the code is run, the debugger will then be launched automatically.
To run the execution under a debugger, a string with the following syntax structure should be used:
Or, for Valgrind only:
where < > denote required arguments, and [ ] optional arguments.
The following debuggers and user interfaces are handled: gdb (GNU Debugger), cuda-gdb, cgdb (console-front-end to gdb), gdbgui (browser-based frontend to gdb), ddd (Data Display Debugger), emacs (as gdb front-end), kdbg (KDbg), kdevelop (KDE developement environment), gede (simple Qt-based gdb GUI), nemiver (GNOME Nemiver debugger), valgrind (Valgrind tools for memory debugging).
If a debugger may not be found in the PATH, an absolute path should be given instead.
The following debug wrapper options are handled:
--asan-bp | adds a breakpoint for gcc's Address-Sanitizer |
--back-end=gdb | path to debugger back-end (for graphical front-ends) |
--breakpoints=LIST | comma-separated list of breakpoints to insert |
--ranks=LIST | comma-separated list of MPI ranks to debug |
--terminal | terminal type to use for console debugger |
Other, standard options specific to each debugger may also be used, as long as they do not conflict with options in this wrapper
To combine a Valgrind tool with another debugger, Valgrind's --vgdb-error=<num> option should be used, where <num> is the number of errors after which Valgrind's gdb server should be invoked. This mode is only compatible with the following debuggers: gdb, gdbgui, ddd, emacs, as the other debugger front-ends do not provide the required startup options to connect with the gdb server.
Note that compared to a standalone use of the gdb debugger, running under the debug wrapper automatically sets breakpoints at program start and end and launch the program.
To define commands such as setting breakpoints, a small gdb script with the .gdb extension is generated for each rank. It can be removed safely after program start.
When running in parallel, several debugging windows will be opened if necessary.
To simply run using the gdb debugger:
To run Valgrind's gdb server, stopping at the second error in the terminal:
To run Valgrind's gdb server, stopping at the second error:
Do do the same using the ddd front-end:
To run under gdb with preset brekpoints at bft_error and exit functions:
To debug under gdbgui:
To run under Valgrind's default tool (Memcheck), with a user Valgrind build
To run under Valgrind's Massif heap profiler:
To allow for debugging parallel runs and combining GDB and Valgrind, GDB is run under a new terminal.
--terminal option.gnome-terminal crashes GDB. Running under the default xterm or konsole works fine.By default, xterm will be used. This usually leads to very small, hard to read fonts. This can be fixed by editing $HOME/.Xresources such as in the following example:
Starting the debugger manually in an execution directory avoids creating many directories and waiting for pre-processing before each run.
cd to the run directory under RESU/<run_id>.cat run_solver to view the execution commands.cs_debug_wrapper.py script, in the python/code_saturne/base directory of the source tree (and in the lib/python<version>/site-packages/code_saturne directory of an installed build).cs_debug_wrapper.py --help for instructions.code_saturne gui <file> (ignoring the directory warning).code_saturne compile -s src_saturne to update the cs_solver executable.The code_saturne debug wrapper does not yet support launching GDB under Vim, Neovim, or Atom.
Various examples of use of debugging with Vim are found on the web, explaining how Termdebug for example can be used.
Support for these tools could be added if users can provide a command-line example for launching a debugging session with their favorite editor and help test this.
Debugging parallel code_saturne runs is not very different from debugging serial runs.
run_solver script in the exection directory), and ignore the rest of this slide.mpiexec -n 2 <program> : - n 1 <debug_wrapper> <program> : -n 3 <program> to debug rank 2 of 6cs_debug_wrapper.py script really becomes useful.--ranks filter option so as to call the debugger only on selected ranks. For example, using --ranks=2,5 will launch MPI ranks 2 and 5 under a debugger, while other ranks will be run normally.print cs_glob_rank_idDebugging OpenMP data races is much more tricky.
private attributes in OpenMP pragmas.valgrind –tool=drd –check-stack-var=yes –read-var-info=yes–disable-linux-futex configure option, so this requires a special build of GCC.When having or suspecting issues with loading or selection of shared libraries, use
before running the code from a terminal. This will log many operations of the dynamic loader.
To obtain more info on available options, use LD_DEBUG=help with any program, for example:
 1.8.13